Overview
- TEM vs. PCM
- Non-Friable Organically Bound Material (NOB)
- Vermiculite
- Direct Microscopy Analysis for Mold Spores
- Metals
TEM vs. PCM
- PCM utilizes a maximum resolution of 400x. NIOSH Method 7400 does not count fibers less than 5.0 microns in length or 0.25 microns in width. It has been our experience that small fibers, which are not visible by PCM, can make up a considerable portion (if not a majority) of fibers released during abatement activity.
- PCM cannot distinguish asbestos fibers from non-asbestos fibers.
- Our TEM scope utilizes a maximum magnification of 3,200,000x. Regular analysis is generally conducted at 19,000x and can resolve fibers less than 0.5 microns in length and 0.01 microns in width.
- By using Selected Area Electron Diffraction (SAED), which allows us to photograph and measure unique mineral diffraction patterns, combined with Energy Dispersive X-Ray Analysis (EDXA), which gives data on the elements present in a mineral, it is possible to positively identify asbestos minerals.
- TEM is technically superior and more defensible in a court of law.
- The EPA strongly recommends that abatement site air clearance collected from public and commercial buildings be analyzed by TEM at NVLAP accredited laboratories. (EPA Federal Register, Vol. 59, No. 23, 02/04/1994)
Non-Friable Organically Bound Material (NOB)
 |
 |
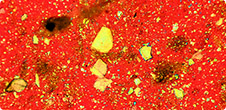
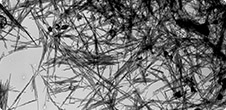
| Floor Tile reported as NAD by PLM | The same Floor Tile analyzed by TEM |
- Five bulk materials have been categorized by the EPA that are very difficult to analyze by Polarized Light Microscopy (PLM). These materials are dominantly non-friable and fall into the following categories:
- Vinyl Material (i.e. floor tiles, sheetings)
- Viscous Matrix Products (i.e. caulks/sealants, adhesives, coatings, joint compound/spackle)
- Cementitious Material (i.e. pipes, sheetings)
- Asphaltic Roofing Materials (i.e. shingles, roof rollings)
- Miscellaneous Products (i.e. frictions plates, gaskets)
- These NOB materials can be problematic when analyzed by PLM. The most common problem is resolution limitation, where the asbestos fibers in certain building materials (especially floor tiles) are smaller than what can be seen by optical microscopy. The other problem is matrix interference, whereby the binding materials in certain building products act as a mask covering up asbestos fibers in the sample.
- The EPA recommends that these materials be analyzed by Transmission Electron Microscopy (TEM) when PLM results are inconclusive. (EPA600/R-93/116, Appendix D)
- The New York State Department of Health requires NOB materials with negative or trace results by PLM to be reanalyzed by TEM. In New York, a material cannot be classified as non-ACM unless analysis by TEM has been performed.
- 2-15% of VFT’s analyzed using only PLM are erroneously reported as negative. (Based on information from NVLAP/AIHA-LAP Proficiency Rounds)
- TEM is the only consistently reliable method for detecting asbestos in NOBs when results reported via PLM are NAD or <1% (NY ELAP 198.4).
- PLM Point Counting does not help in the visualization of asbestos fibers in NOB samples that have not been gravimetrically reduced.
Vermiculite
Vermiculite is a naturally occurring mineral used in insulation, packaging, garden products, and numerous other products. For decades, one of the primary sources of vermiculite was from a mine in Libby, Montana. Unfortunately, the vermiculite from Libby contains naturally occurring asbestiform amphiboles: Winchite, Richterite, Tremolite, and Actinolite. When dealing with vermiculite these four minerals are routinely identified as “Libby Amphiboles”. Libby amphiboles are not distributed homogeneously throughout the vermiculite. This makes it difficult to quantify the amount. We use a modified version of a method under study by the EPA to prepare and analyze vermiculite. The results are reported qualitatively for the presence or absence of Libby amphiboles.
Direct Microscopy Analysis for Mold Spores
- Mold Spores can be detected and enumerated using Spore Traps/Air Samples, Surface Tape Lifts, Surface Swab Samples, Surface Vacuum Dust Samples, and Bulk Samples.
- An outside Spore Trap/Air Sample should be submitted for analysis to compare the number and kinds of mold spores present outside to what is found inside a building or test site. The Outside Sample can set a baseline for comparison and the absence of one can make interpreting data extremely difficult.
- Spore trap cassettes and MCE slides exposed to hot temperatures can cause the gelatin to melt. This creates uneven and distorted traces. Store all spore traps in coolers.
- Surface tape lifts should only be done with clear tape and submitted in a plastic bag, such as a zip-lock bag. Surface tapes can also be submitted on microscope slides or be collected with Bio-Slides, which have been specifically designed for this type of sample collection. Frosted tape is difficult to analyze. Duct tape and mastic tape cannot be analyzed.
- Results are reported in Spores/m³ for air samples and Spores/in2 for tape and bulk samples.
- Since there are no regulations regarding mold concentrations in the environment at this time, the interpretation of Mold Sample results is performed by the IH or CIH who collected and submitted the samples.
- AMA is accredited for Spore Trap analysis by ASTM D7391 in AIHA-LAP’s EMLAP Program.
Metals
We use a Flame Atomic Absorption Spectrometer (FLAA), which has an analytical sensitivity in parts per million (ppm). This level of detection is acceptable for the following matrices:
| Lead (Pb) | Copper (Cu), Arsenic (As) |
|---|---|
| Air | Drinking Water |
| Dust Wipes | |
| Soil/Solid | |
| Paint Chips | |
| TCLP | |
| Waste Water |
A graphite furnace Atomic Absorption Spectrometer (GFAA) has a significantly lower analytical sensitivity in part per billion (ppb). This instrument is used primarily for the analysis of lead (Pb) and arsenic (As) in Drinking Water.
The regulatory levels for lead and copper matrices are included in the table below:
| Matrix | Regulatory Level | Agency |
|---|---|---|
| Pb Air | 30 µg/m³ (Action Level) 50 µg/m³ (PEL) |
OSHA OSHA |
| Pb Dust Wipes* | 40 µg/ft² – Floors 250 µg/ft² – Sills 400 µg/ft² – Troughs (Wells) |
EPA/HUD EPA/HUD EPA/HUD |
| Pb Soil/Solid* | 400 ppm (Residential Play Areas) 1200 ppm (Drip Lines) |
EPA EPA |
| Pb Paint Chips | 0.50% | EPA |
| Pb TCLP | 5 mg/L | EPA |
| Pb Waste Water | 5 mg/L | EPA |
| Pb Drinking Water | 15 ppb | EPA |
| Cu Drinking Water | 1.3 ppm | EPA |
* for target housing and child occupied facilities


